Utilize the Communication Activity Report to gauge student engagement in class conversations through posts, replies, and reactions, enhancing online learning and digital education. This valuable tool provides insights into how actively students are participating in virtual classrooms and distance education settings.
By leveraging this report, educators can monitor student interaction and engagement levels, crucial for blended learning, hybrid learning, and various e-learning platforms. The Communication Activity Report helps identify which students are actively contributing and which may need additional encouragement or support.
Filter
By default, your report reflects all students, all channels, this week. You can use the filters to customize your report depending on what you want to see. Select 
-
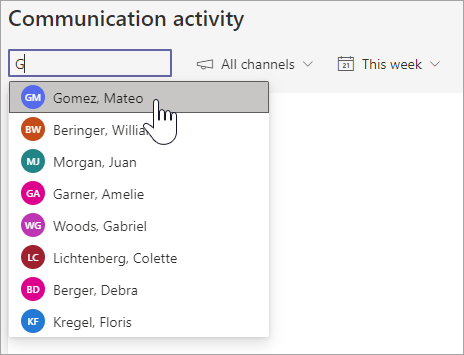
Student filter: type a student's name in the Search student box to narrow your data to that individual student.
-
Channel filter: View data from all channels in your class team or customize your selection with one or multiple channels.
-
Time filter: select This week to open a dropdown of additional timeframe options.
-
Select Custom range to enter your own dates for a timeframe that can begin as far back as class creation or up to a year prior to the date of your search, whichever is more recent.
-
Read your data
-
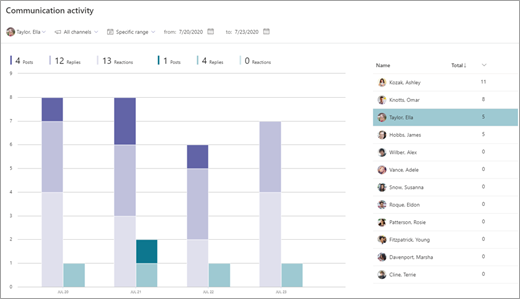
Posts, replies, and reactions are each represented by different shades within a column.
-
Filter for an individual student to view their activity compared to the class averages—individual activity will be reflected in a separate column from the class activity column.
-
Hover over a student column to see their activity for a certain date.
-
If you filter for one or more channels, you can see how active the students were in a specific channel.
-
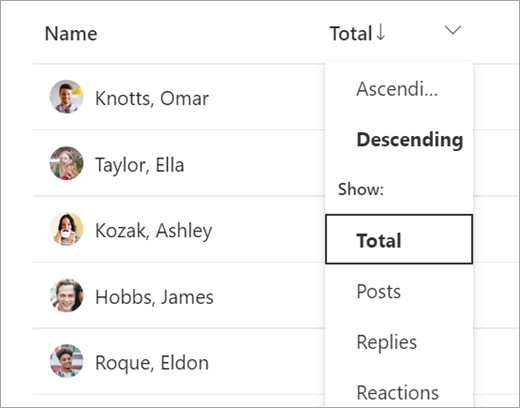
Use the student list to the right of the graph to see each student's activity count for the selected channels and time frame.
Tip: Select
Export your data to Excel
-
In your report, select More options

-
Select Export to Excel.
-
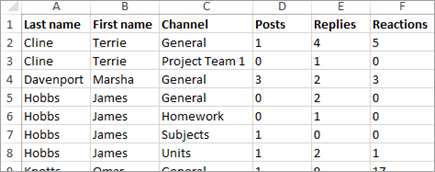
Your Excel spreadsheet will reflect a column each for posts, replies, and reactions, plus the channel where the student was active.
Note: You can view the selected time frame for your exported data in the Excel file name.
Classroom use cases for mobilizing your Communication activity report:
-
Filter for All students and a specific channel to see who was active in that channel. You can then check the posts to see who offered help, who needed help, or who didn’t participate.
-
If you create a channel for certain topics or units, you can use this report to measure participation for those subject areas.
-
Prompt students to help each other and share their knowledge with the class with a daily or weekly challenge in a channel. Ask students to share a lesson summary, help other students with their homework, or reply to questions. Filter your report by that channel and see which students stepped up to the challenge.