If you want to see specific data from a large data set, you can ask Copilot to create a PivotTable. With Copilot, you don’t have to do a lot of steps—just ask for what you want.
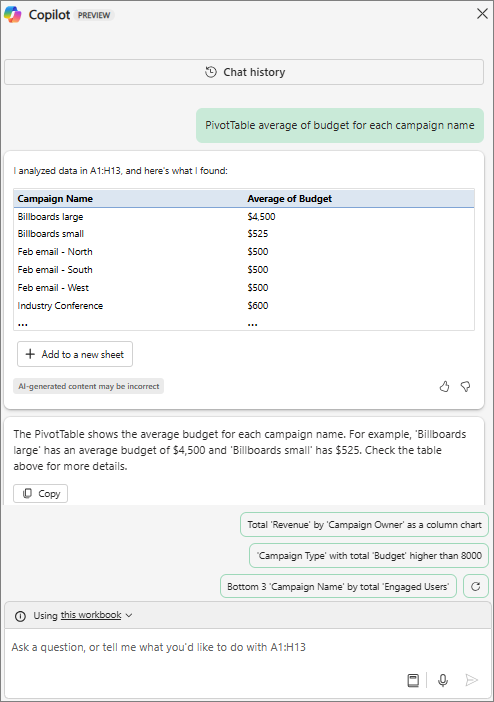
Let’s say you have a large data set from your Marketing team. Perhaps it includes data for year, month, type of marketing campaign, product, cost of campaign, budget, revenue, and much more. If you just want to compare what was budgeted for different types of campaigns, you could ask Copilot for a PivotTable that includes only the campaign types and the average budget for each type.
Note: To access Copilot, you’ll need to meet license requirements.
Create a PivotTable with Copilot
-
Open Excel.
-
Select Copilot

-
Enter your prompt and start working with Copilot. The more details you include about what you want, the better the results. If you don’t provide details, you’ll see a generic PivotTable, and you can ask Copilot to show you another if it isn’t what you’re looking for. Here are examples of prompts you could enter:
-
Show PivotTables.
-
Create a PivotTable.
-
Summarize with PivotTable.
-
Can you make a pivot table from this data and show a summary by Report Date?
-
PivotTable with sum of sales with month in rows and category in columns.
-
Learn more
Create a PivotTable to analyze worksheet data